Google Analytics has been an essential tool for website owners and digital marketers for over a decade. Like any tool, it must constantly upgrade to keep up with technology and privacy demands. Enter the latest version of Google Analytics: Google Analytics 4, otherwise known as ‘GA4.’
GA4 represents a significant shift in the way website data is collected, processed, and analysed. While it retains some features from the previous version of Google Analytics, Universal Analytics (UA), it also boasts a heap of updated and new features. Don’t worry, it’s still completely free to use.
So, GA4 vs Universal Analytics … what exactly is the difference?
This blog post will focus on 5 key differences you need to know for getting the most from your Google Analytics account, including:
- Updated metrics
- Removed metrics
- How data is tracked
- Cross-device tracking
- Reporting
Let’s get right into it.
A Little Context
Website owners have been using UA since 2012, however, the platform has struggled to keep up as our digital landscape quickly evolves. Google released GA4 as the newest version of Google Analytics in October 2020.
The shift to GA4 is being made to adapt to the changing needs of digital marketers and to improve user privacy protections. It uses machine learning to deliver more accurate and predictive insights, and offers a more comprehensive method of tracking data while simultaneously improving its user privacy protections.
GA4 will come into full effect on July 1 2023, which means you need to transition all Universal Analytics property before then.
#1: Updated Metrics
GA4 has introduced several new metrics and updated some of the existing UA ones. Here are the more notable updates:
Sessions and Users:
In GA4, the “Sessions” metric has been replaced with “Engaged Sessions,” which counts only the sessions where users engaged with content. Similarly, the “Users” metric has been replaced with “Distinct Users,” which counts unique users who engaged with your website or app content.
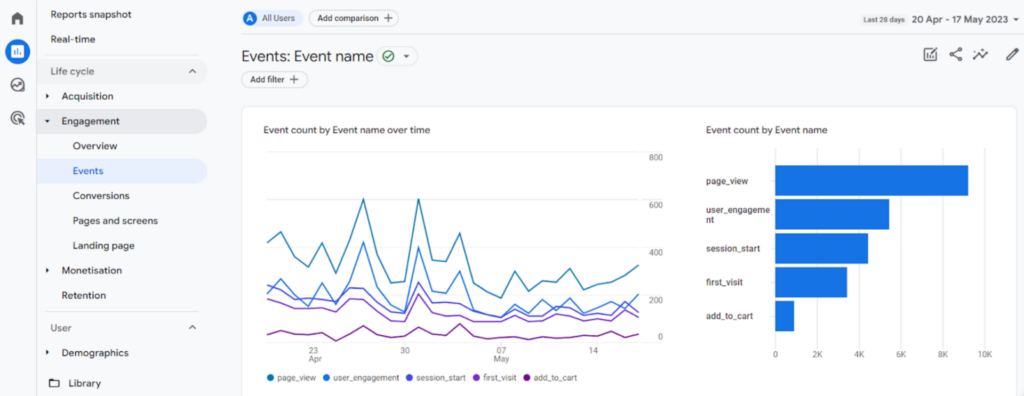
Events:
GA4 has introduced a new metric called “Event Count,” which shows the total number of events tracked in a given time frame. This metric is helpful to understand your users’ engagement rate.
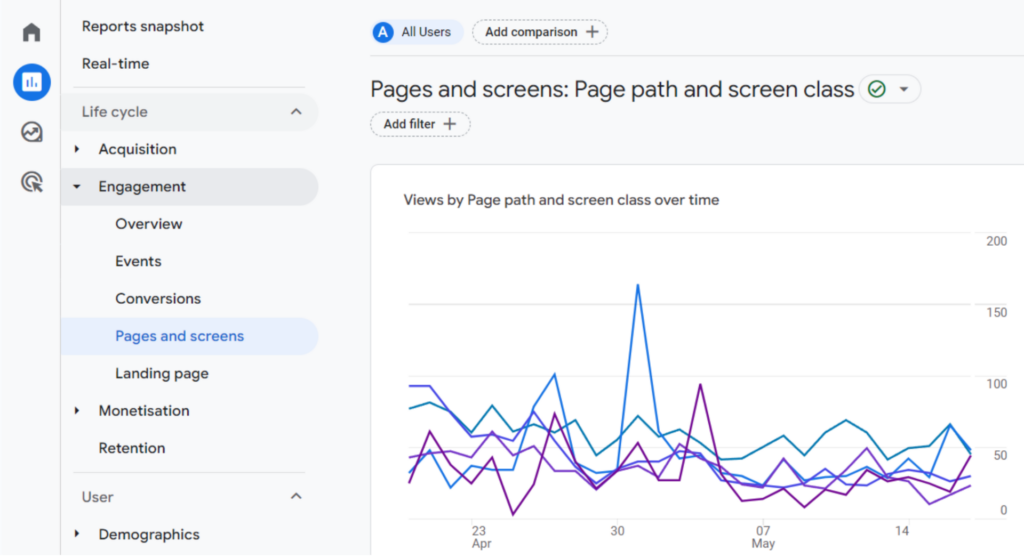
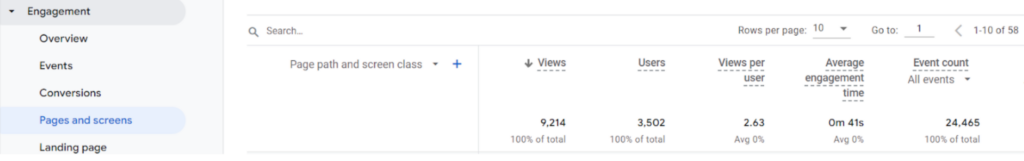
Pageviews:
The “Pageviews” metric in GA4 is similar to UA, but now includes both page views and screen views. In addition, GA4 has introduced a new metric called “Engaged Pageviews,” which shows the number of times users engaged with the content on a page or screen.
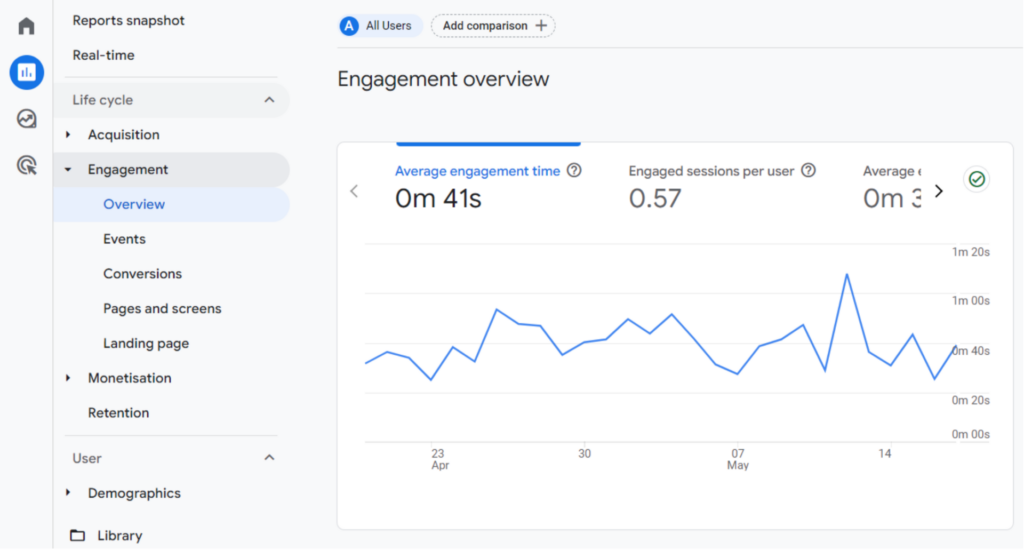
Time on Page:
The “Time on Page” metric in GA4 has been replaced with “Engaged Time,” which shows the total time users spent actively engaging with the content on a page or screen.
Goal Conversion Rate:
GA4 has introduced a new metric called “Conversion Rate,” which shows the percentage of engaged sessions that resulted in a conversion event. This metric provides a better understanding of how effective your website or app is at converting engaged users.
Google has a more detailed comparison of Universal Analytics and Google Analytics 4 metrics here.
#2: Removed Metrics
Say goodbye to ‘Bounce Rate!’
In Universal Analytics, Bounce Rate was a metric used to measure the percentage of single page sessions in which there were no user interactions with the webpage, such as clicking a link or triggering an event, even if the user stayed on the page for several minutes. A ‘bounced’ session would count as 0 seconds.
This is not the best measurement of page engagement. For example, someone could spend minutes reading a blog post and leave without triggering any events, so their session would be considered a bounce even though they were actually engaged in your website content.
GA4 offers a different measurement model. Page engagement is now viewed more positively with the all-new metric ‘Engagement Rate,’ which measures the number of engaged sessions on a page. An engaged session is one that lasts longer than 10 seconds, has 1+ conversion events, or 2+ page or screen views. If a user does not meet any of these criteria, GA4 does not consider it an engaged session and will then count it as a bounce.
Marketers worldwide agree this provides a more accurate and positive reflection of user engagement with a website.
#3: How Data Is Tracked
A very notable difference between GA4 and UA is how Google Analytics 4 tracks data. GA4 measures events-based data, while UA was based on sessions and page views.
As far as analysis capabilities are concerned, this is a significant upgrade because it allows for a more granular and accurate view of how users have meaningful interactions with a business’s website or app. For example, video plays or button clicks (both considered events) are more valuable than page views, therefore providing greater insights for web developers and marketers to use.
This is done by creating data streams. According to Google, a data stream is a flow of data from a customer touchpoint (e.g., app/website) to Analytics. When you create a data stream, Analytics generates a snippet of code that you add to your app or site to collect that data. Data is then collected from the user’s web browser from the time you add the code, and that data forms the basis of your reports.
GA4 is also much more privacy-focused than UA. It collects data using first-party cookies and AI rather than third-party cookies or collecting IP addresses, which keeps it compliant with major privacy laws.
Finally, data can now be tracked across different platforms and devices. Read on to learn more about this in key difference #4.
#4: Cross-Device Tracking
GA4 can track a single user’s journey and behaviour across numerous sessions and different platforms and devices. This provides a much more holistic view of how people interact with your business online compared to Universal Analytics, which could not integrate web data and app data.
This is because GA4 assigns a unique user ID to each user, allowing it to track their journey across different devices (mobile phones, tablets, and laptops) and platforms (website and app). It also creates reports on aggregate cross-domain user specific data in a single view, something Universal Analytics was never able to do, while still providing the option to break the report down into data per stream.
We love this feature because it provides a far more accurate picture of active users and their behaviour, therefore helping businesses improve their multi-channel and multi-platform marketing strategy. It’s helpful for everyone, but particularly insightful for businesses with an app in addition to their website and those working with ecommerce data.
#5: Reporting
GA4 has a new and improved reporting interface to match its different data models.
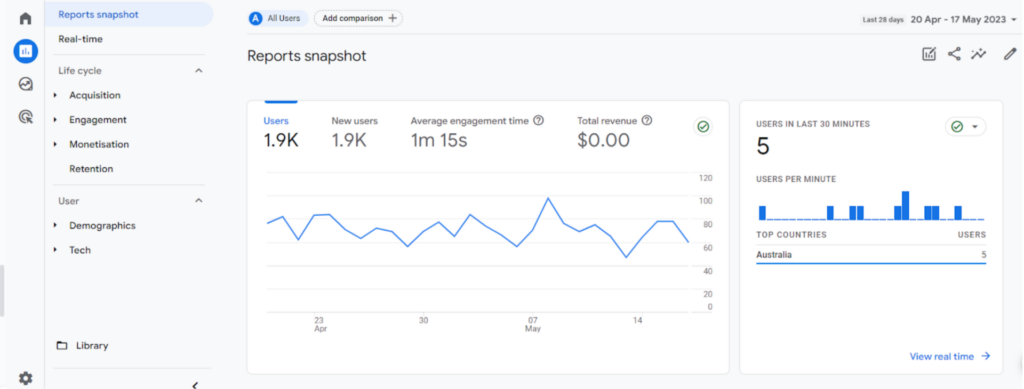
While UA had a greater list of predefined reports, GA4 has fewer predefined options and the excellent new ability to create custom reports. You can now click the ‘customise report’ button to change the arrangement of your data cards and curate reports based on what data is important to you.
Navigating to your reports within GA4’s interface is also slightly different. While UA uses the ‘Reports’ menu on the left-hand-side, you can access your reports in GA4 through the ‘Overview’ section, then by clicking on a specific report widget. Reports are broken down into two main catgories: Lifecyle and User, so it may not be immediately apparent where the equivalent UA reports are.
Spend some time exploring GA4’s interface to help familiarise yourself with navigation changes, or use online resources that list exact UA vs. GA4 report navigation equivalents.
Other GA4 Updates:
Better search capability: GA4’s search feature is much more intuitive, suggesting completed questions and your recent searches when you start typing. Hooray!
Better product integration: Google Tag Manager, Google Ads, and Google Merchant Center integrate seamlessly with GA4, meaning better visibility in reporting and identifying high-value audiences to use in your Google Ads account.
Advanced machine learning capabilities: GA4 uses machine learning to help predict what actions a user will take in the future with three new predictive metrics: Purchase Probability, Churn Probability, and Predicted Revenue.
How To Migrate From UA to GA4
Migrating from Universal Analytics to Google Analytics 4 can be a daunting task, but it’s an essential one. Collecting data that informs your business and marketing strategies ensures you can keep optimising your business and marketing strategies to hit your goals.
You must migrate from UA to GA4 by July 1 2023. The process involves setting up a new GA4 property, importing historical data, and configuring event tracking codes to collect data.
If you’re not sure where to start, it’s a good idea to engage a digital marketing agency to help keep the migration process seamless and stress-free. A digital agency will provide expert guidance and help you customize your reports to ensure you’re getting the most out of your data.
Getting started? Check out the Google Analytics Help Centre and this Google resource on how to make the switch to Google Analytics 4 for helpful information straight from the source.
Final Thoughts
Google Analytics 4 signals a whole new era of data collection and insights, and we’re excited about it. Although it may feel tricky making the transition from Universal Analytics to Google Analytics 4, it’s totally worth investing a bit of time and effort now. Trust us, you’ll thank your future self for collecting data correctly.
Working with a digital agency is the best way to seamlessly migrate your Universal Analytics properties over to Google Analytics 4, so feel free to reach out to the Springboard Digital team. We specialise in all things Google, Meta, websites, and more, and are always here to help.
If you liked this article, you’ll like our other digital marketing blog posts. Feel free to share this with your network to help combat the GA4 confusion.